1 Spyder: The Scientific Python Development Environment
1.1 Introduction
Hans Fangohr (European XFEL & University of Southampton).
This blog entry has been integrated into Spyder as the Tutorial. Once Spyder has started, the most up-to-date version of this tutorial can be found under Help -> Spyder tutorial.
See the Spyder website for more information and documentation on the IDE.
Outline
- 1 Spyder: The Scientific Python Development Environment
Spyder is an Integrated Development Environment (IDE) for scientific computing, written in and for the Python programming language. It comes with an Editor to write code, a Console to evaluate it and view the results at any time, a Variable Explorer to examine the variables defined during evaluation, and several other facilities to help you effectively develop the programs you need as a scientist.
This tutorial was originally authored by Hans Fangohr from the University of Southampton (UK), and subsequently updated for Spyder 3.3.x by the development team (see Historical note for more details).
1.2 First steps with Spyder
This section is aimed at Python and Spyder beginners. If you find it too simple, please continue to the next one.
1.2.1 Execute a given program
We are going to run this program as a first example:
# Demo file for Spyder Tutorial
# Hans Fangohr, University of Southampton, UK

def hello():
    """Print "Hello World" and return None."""
    print("Hello World")

# Main program starts here
hello()
Please create a new file in the Spyder Editor pane (with File --> New file, or Ctrl-N/ Command-N). Then copy and paste the code inside the box above into the file, and save it with the name hello.py.
To execute the program, select Run --> Run from the menu (or press F5), and confirm the Run settings if required.
If this is your first time running something, you should see an output like this:
In [1]: runfile('/File/Path/hello.py', wdir=r'/File/Path')
Hello World

In [2]:
If so, then you have just run your first Python program -- well done.
Note
The particular paths shown inside runfile() will depend on where you have saved the file, but this is inserted by Spyder automatically.
1.2.2 What happens when you execute a program?
Python reads the file line by line, ignoring comments (i.e. lines starting with the # symbol).
When it comes across the def keyword, it knows that a function is DEFined in this and the next (one or more) lines. All indented lines following def hello(): belong to the function body.
Note that the function object is created at this point in the file, but the function is not yet called (i.e. not executed).
When the Python interpreter encounters commands (other than def ... and a few other keywords) that are written in the left-most column, it will execute these immediately.
In the hello.py file this is only the line reading hello() which will actually call (i.e. execute) the function with name hello.
If you comment or remove the line hello() from the program and run the whole file again (by pressing F5, or selecting Run --> Run), nothing will be printed (because the function hello is defined but not called, i.e. not executed).
Now you should know how to execute a Python program that you have in the Editor pane in Spyder using the IPython Console.
If you are just starting to learn Python, this is probably a good point to return to your text book/course and look at further basic examples.
The next section gives more detailed information how you can execute parts of your code from the Editor in the IPython Console. This is a more advanced technique but can be very useful. You may also be interested in the option to execute "cells", chunks of code that are separated by delimiters.
1.2.3 Call existing functions in the Console
Once you have executed the hello.py program, the function object hello is defined and known to the IPython Console. We can thus call the function from the Console.
Type hello() in the Console (next to In [?] prompt, where ? is a count of the number of times you've executed something), and press the Enter key.
You should find that the hello() function is executed again, i.e. printing Hello World a second time. Your function call at the Console together with the output should look like this:
In [ ]: hello()
Hello World
Can you see how this differs from executing the whole program again?
When we execute the whole program (by pressing F5), Python goes through the file, creates the hello function object (overriding the previous object), reaches the hello() line and calls the function.
When we call hello() in the Console, we only call the function object hello that has been defined in the IPython Console when we executed the whole hello.py file earlier (by pressing F5).
This will become clearer over time, as we work with larger examples. You may want to return to this tutorial at a slightly later stage.
1.2.4 Inspecting objects defined in the Console
Python provides a function that displays all known objects in the current namespace of the Console, called dir. Type dir() at the prompt, and ignore everything starting with an underscore (_) for now. Can you see hello in the list?
Note
If you get a long list of defined objects, then Spyder may have done some convenience imports for you already. To address this you may want to reset the namespace, execute hello.py again by pressing F5, then run dir() as suggested above.
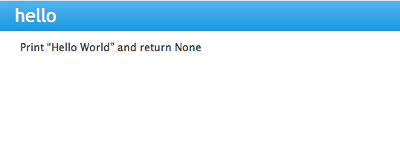
Once an object is visible in the current namespace (as is hello in this example), we can use the help function as follows to learn about it. Typing help(hello) at the Console prompt, you should see an output like this:
In [ ]: help(hello)
Help on function hello in module __main__:

hello()
    Print "Hello World" and return None.
Where does Python get that information from? Some of it (like the number of input arguments and names of those variables; here we have none) Python can find through inspecting its objects. Additional information comes from the documentation string provided for the function object hello. The documentation string, or docstring, is the first string immediately below the line def hello():. By convention, and as they usually extend over multiple lines, they are enclosed by triple double quotes (""").
The Spyder environment also provides a Help pane which by default is located in the top right corner.
While the cursor is on the name of an object, press Ctrl-I (or Command-I on macOS), and you should find that the same information as we obtained from help(hello) is provided automatically in the Help pane:
This works in the Console and in the Editor.
1.2.5 Updating objects
Let's say you wanted to change how an existing function behaves -- how should you get Python to recognize your changes?
1.2.6 Simple strategy: Re-execute whole program
In the Editor window, change the function hello so that it prints Good Bye World rather than Hello World.
Press F5 (to execute the whole program)
Check that the output of the program is now:
Good Bye World
What has happened when you pressed F5 is this: Python has gone through the hello.py file and created a new function object hello (overriding the function object hello we had defined before) and then executed the function.
1.2.7 Looking at the details
We'll now investigate this behavior in a little more depth:
We need to start with a clearly defined state. To do this, please change the function hello() back so that it prints Hello World, then press F5 to run the whole program and check that it prints Hello World.
Call the function hello() from the command prompt (as described previously). You should see Hello World printed.
Now change the function definition so that it would print Later World, and save the file (but do NOT execute the program, i.e. do NOT press F5 yet).
Call the function hello() in the Console again. You should find that the text printed reads Hello World, like here:
In [ ]: hello()
Hello World
Why is this so? Because the hello function object in the Console is the old one which prints Hello World. So far, we have changed the file hello.py (and replaced Hello World in there with Later World) in the Editor but this has not affected the objects that have previously been created in the Console.
To update the console's namespace with modified function, we have two options:
Option 1: Execute the whole file hello.py again by pressing F5: this creates a new function object hello (and overrides the old one). You should find that if you press F5, and then call hello() at the prompt, the new text Later World is printed.
Option 2: Select the region you have changed (in this case the whole function hello, starting from the line def hello(): down to print("Later Wold"), then click Run --> Run selection or current line or press F9.
This will update the hello object in the Console without having to execute the whole hello.py file:
In [ ]: def hello():
   ...:     """Print "Hello World" and return None."""
   ...:     print("Later world")
   ...:
If we now type hello(), we see the updated response:
In [ ]: hello()
Later world
The ability to execute parts of the code to update some objects in the Console (in the example above, we updated the function object hello), is of great use when developing and debugging more complex programs, and when re-creating objects/data in the Console session takes time. For example, by modifying only the functions (or classes/objects, etc). that we are actually developing or debugging, we can keep re-using the data and other objects created previously.
1.3 Recommended first steps for Python beginners
Before we begin, make sure to have an IPython Console open (bottom-right by default). This uses the IPython interpreter, standard in the scientific community. To open a new Console at any time, select Consoles --> Open an IPython Console.
1.3.1 Reset the namespace
The namespace (i.e. the collection of objects defined in the Console at any given time) can be cleared in IPython using the %reset command. Type %reset and press Enter, then confirm with y:
In [1]: %reset

Once deleted, variables cannot be recovered. Proceed (y/[n])? y

In [2]:
You can also accomplish the same thing by selecting Remove all variables from the "Gear" option menu in the top right of the IPython Console pane. We discuss this a little further, but you can skip the following if you are not interested.
After issuing the %reset command or selecting Remove all variables, we should only have a few objects defined in the namespace of that session. We can list all of them using the dir() command:
In [2]: dir()
Out[2]:
['In',
'Out',
'__builtin__',
'__builtins__',
'__name__',
'_dh',
'_i',
'_i2',
'_ih',
'_ii',
'_iii',
'_oh',
'_sh',
'exit',
'get_ipython',
'quit']
Finally, if you like to skip the confirmation step of the reset command, you can use %reset -f instead of %reset; or, tick the Don't show again checkbox in the Remove all variables dialog.
1.3.2 Strive for PEP8 Compliance
In addition to the syntax that is enforced by the Python programming language, there are additional conventions regarding the layout of the source code, in particular the Style Guide for Python source code known as "PEP 8". By following this guide and writing code in the same style as almost all Python programmers do, it becomes easier to read, and thus easier to debug and re-use -- both for the original author and others.
To have Spyder check this for you automatically, see the next section.
1.4 Selected preferences
1.4.1 Where are the preferences?
A lot of Spyder's behaviour can be configured through its Preferences. Where this is located in the menu depends on your operating system:
- On Windows and Linux, go to Tools --> Preferences
- On macOS, navigate to Python/Spyder --> Preferences
1.4.2 Warn if PEP 8 code style guidelines are violated
Go to Preferences --> Editor --> Code Introspection/Analysis and tick the checkbox next to Real-time code style analysis.
1.4.3 Automatic Symbolic Python
Through Preferences --> IPython console --> Advanced Settings --> Use symbolic math we can activate the console's SYMbolic PYthon (sympy) mode that is provided by the SymPy Python package. This allows nicely rendered mathematical output (LaTeX style), imports some SymPy objects automatically when the IPython Console starts, and reports what it has done. You'll need to have SymPy installed for it to work, and a LaTeX distribution on your system to see the formatted output (see the Getting LaTeX page on the LaTeX site to acquire the latter, if you don't already have it).
These commands were executed:
>>> from __future__ import division
>>> from sympy import *
>>> x, y, z, t = symbols('x y z t')
>>> k, m, n = symbols('k m n', integer=True)
>>> f, g, h = symbols('f g h', cls=Function)
We can now use the variables x and y, for example like this:

1.5 Shortcuts for useful functions
Note
The following are the default shortcuts; however, those marked with * can be customized through the Keyboard shortcuts tab in the Preferences. Also, macOS users should substitute Command for Ctrl, and Option for Alt.
F5* executes the current file.
F9* executes the currently highlighted chunk of code; this is very useful to (say) update definitions of functions in the Console session without having to run the whole file again. If nothing is selected, F9* executes the current line.
Tab* auto-completes commands, function names, variable names, and methods in the Console and the Editor. This feature is very useful, and should be employed routinely. Do try it now if auto-completion is new to you. Assume you have defined a variable:
mylongvariablename = 42
Suppose we need to write code that computes mylongvariablename + 100. We can simply type my and then press the Tab key. The full variable name will be completed and inserted at the cursor position if the name is unique, and then we can carry on and type `` + 100``. If the name is not uniquely identifiable given the letters my, a list field will be displayed from which the desired variable can be chosen. Choosing from the list can be done with the Up and Down keys with the Enter key to select, or by typing more letters of the name in question (the selection will update automatically) and confirming by pressing Enter when the appropriate name is identified.
Ctrl-Enter* executes the current cell (menu entry Run --> Run cell). A cell is defined as the code between two lines which start with the characters #%%, # %% or # <codecell>.
Shift-Enter* executes the current cell and advances the cursor to the next cell (menu entry Run --> Run cell and advance).
Cells are useful for breaking large files or long blocks of code into more manageable chunks. Like those in an IPython notebook, each cell can be run independently.
Alt-Up* moves the current line up. If multiple lines are highlighted, they are moved up together. Alt-Down* works correspondingly, moving line(s) down.
Ctrl-LeftMouseButton or Alt-G* on a function/method in the Editor opens a new Editor tab showing the definition of that function.
Shift-Ctrl-Alt-M* maximizes the current window (or changes the size back to normal if pressed in a maximized window).
Ctrl-Shift-F* activates the Find in Files pane, allowing grep-like searches across all files in a specified scope.
Ctrl - = will increase the font size in the Editor or the Console, whereas Ctrl - - will decrease it.
The font face and size for other parts of the UI can be set under Preferences --> General --> Appearance --> Fonts.
Ctrl-S* in the Editor saves the file currently being edited. This also forces various warning triangles in the left column of the Editor to be updated (otherwise they update every 2.5 seconds by default, which is also configurable).
Ctrl-S* in the Console saves the current IPython session as an HTML file, including any figures that may be displayed inline. This is useful as a quick way of recording what has been done in a session.
(It is not currently possible to load this saved record back into the session -- if you need functionality like this, look for the IPython Notebook).
Ctrl-I* when pressed while the cursor is on an object opens documentation for that object in the help pane.
1.6 Run configuration
These are the settings that define how the file in the Editor is executed if we select Run --> Run or press F5.
By default, the settings box will appear the first time we try to run a file. If we want to change the settings at any other time, they can be found under Run --> Configure or by pressing F6.
There are three choices for the Console to use, of which I'll discuss the first two. Let's assume we have a program hello.py in the Editor which reads
def hello(name):
    """Given an object 'name', print 'Hello ' and the object."""
    print("Hello {}".format(name))


i = 42
if __name__ == "__main__":
    hello(i)
1.6.1 Execute in current console
This is the default option, and generally a good choice.
1.6.2 Persistence of objects after code execution
Choosing the Execute in current console setting under Run --> Configure means that:
- When the execution of hello.py is completed, we can interact with the Console in which the program ran.
- In particular, we can inspect and interact with objects that the execution of our program created, such as i and hello().
This is generally very useful for incremental coding, testing and debugging. For example, we can call hello() directly from the Console prompt, and don't need to execute the whole hello.py for this (although if we change the function hello(), we need to execute the file, or at least the function definition, to make the new version of hello() visible at the Console; either by re-executing the whole script or via Run --> Run Selection).
1.6.3 Persistence of objects from before code execution
However, executing the code in the Editor in the current Console also entails a third effect:
- The code that executes can see other (global) objects that were defined in the Console session.
This persistence of objects is easily forgotten and usually not required when working on small programs (although it can be of great value occasionally). These objects could come from previous execution of code, from interactive work in the Console, or from convenience imports such as from sympy import * (Spyder may do some of those convenience imports automatically).
This visibility of objects in the Console namespace to the code we execute may also result in coding mistakes if the code inadvertently relies on these objects.
Here is an example: Imagine that:
- We run the code hello.py. Subsequently, the variable i is known in the Console as a global variable.
- We edit the hello.py source and accidentally delete the line i = 42.
- We execute the file containing hello.py again. At this point, the call of hello(i) will not fail because the Console has an object of name i defined, although this is not defined in the source of hello.py.
At this point, we could save hello.py and (falsely) think it would execute correctly. However, running it in a new IPython Console session (or via python hello.py in a system shell, say) would result in an error, because i is not defined.
The problem arises because the code makes use of an object (here i) without creating it first. This also affects importing of modules: if we had imported sympy at the IPython prompt, then our program will see that when executed in this IPython Console session.
To learn how we can double check that our code does not depend on such existing objects, see below .
1.6.4 Execute in a dedicated console
Choosing Execute in a dedicated console under Run --> Configure will start a new IPython Console every time the hello.py program is executed. The major advantage of this mode over Execute in current console is that we can be certain that there are no global objects defined in this Console which originate from debugging and repeated execution of our code. Every time we run the code in the Editor, the IPython Console in which the code runs is restarted.
This is a safe option, but provides less flexibility in interactive execution.
1.6.5 How to double check your code executes correctly "on its own"
Assuming you have selected the Execute in current console option, you have two methods to check that your code works on its own (i.e. it does not depend on undefined variables, unimported modules and commands etc):
Switch from Execute in current console to Execute in a dedicated console, and run the code from the Editor.
Alternatively, if you want to stay with the current Console, you can
First reset the namespace with IPython's magic %reset command or the Remove all variables menu option, which will clear all objects, such as i in the example above from the current namespace. Then, execute the code from the Editor.
1.6.6 Recommendation
My recommendation for beginners would be to Execute in current console.
Once you have completed a piece of code, double check that it executes independently using one of the options explained above.
1.7 Other observations
1.7.1 Multiple files
When multiple files are opened in the Editor, the corresponding tabs at the top of the window area are arranged in the order they are opened, but can be easily moved around if you wish.
On the left of the tabs, there is as icon that shows Browse tabs if the mouse hovers over it. It is useful to jump to a particular file directly, if many files are open. You can also summon the file switcher through tapping Ctrl-Tab or Ctrl-P, which navigates your tabs in most-recently-used order.
1.7.2 Environment variables
Environment variables can be displayed from the IPython Console window (bottom right window in default layout). Click on the Options menu ("Gear" icon), then select Show environment variables.
1.7.3 Reset all customization
All customization saved on disk can be reset by calling Spyder from the command line with the switch --reset, i.e. running spyder --reset.
1.7.4 Objects in the Variable Explorer
Right-clicking on objects in the Variable Explorer displays options to plot and analyze these further.
Double-clicking on simple variables allows them to be edited directly, and double-clicking on objects opens a new window that displays their contents and often allows them to be edited.
Python collections (lists, dictionaries, tuples...), Numpy arrays, Pandas Index, Series and DataFrame, Pillow images and more can each be displayed and edited in specialized GUI viewers, and most arbitrary Python objects can be viewed, browsed and edited like their dict() representation.
1.8 Documentation string formatting
If you want to document the code you are developing (and you certainly should!), we recommend you write documentation strings (or docstrings) for it, using a special format called reStructuredText (reST). In the scientific Python world, a further set of conventions called the Numpydoc standard is typically followed (although other systems exist). If you follow those guidelines, you can obtain beautifully formatted docstrings in Spyder.
For example, to get an average() function look like this in the Spyder Help pane:
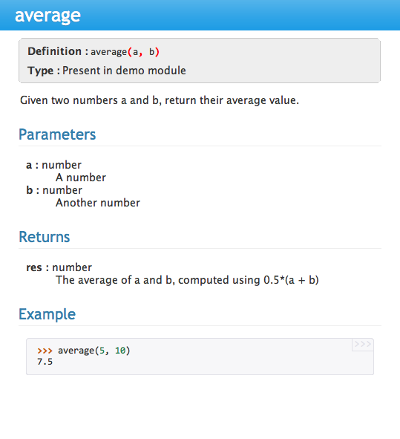
you need to format the documentation string as follows:
def average(a, b):
    """
    Return the average value (arithmetic mean) of two numbers.

    Parameters
    ----------
    a : numeric
        A number to average.
    b : numeric
        Another number to average.

    Returns
    -------
    result : numeric
        The average of a and b, computed using ``0.5 * (a + b)``.

    Example
    -------
    >>> average(5, 10)
    7.5

    """

    return (a + b) * 0.5
What matters here is that the word Parameters is used, and underlined. The line a : numeric shows us that the type of the parameter a is numeric. In the next line, which is indented, we can write a more extended explanation of what this variable represents, what conditions the allowed types have to fulfill, etc.
The same for all parameters, and also for the returned value.
Often it is a good idea to include an example too, as shown.
1.9 Debugging
1.9.1 Line by line step execution of code
Start debug execution (with the Debug --> Debug menu option or Ctrl-F5) to activate the IPython debugger, ipdb. The Editor pane will then highlight the line that is about to be executed, and the Variable Explorer will display variables in the current context of the point of program execution.
After entering debug mode, you can execute the code line by line using the Step button of the Debug toolbar:

or the shortcut Ctrl-F10. You can also inspect how a particular function is working by stepping into it with the Step Into button

or the shortcut Ctrl-F11. Finally, to get out of a function and continue with the next line you need to use the Step Return button

or the shortcut Ctrl-Shift-F12.
If you prefer to inspect your program at a specific point, you need to insert a breakpoint by pressing F12 on the line on which you want to stop, or double-clicking to the left of the line number. A red dot in this position indicates a breakpoint; it can be removed by repeating the same procedure.
After entering the Debugger, you can press the Continue button

to stop the execution at the first breakpoint.
Note
You can also control the debugging process by issuing these commands at the Console prompt:
- n to move to the Next statement.
- s to Step into the current statement. If this is a function call, step into that function.
- r to complete all statements in the current function and return from that function before returning control.
Inside the debugger, you can also interactively execute many of the statements you can normally, including assigning and modifying variables, defining and calling functions, setting new breakpoints, and more.
For example, enter the following code into a new or temporary file:
def demo(x):
    for i in range(5):
        print("i = {}, x = {}".format(i, x))
        x = x + 1

demo(0)
If we execute this (Run --> Run), we should see the output:
i = 0, x = 0
i = 1, x = 1
i = 2, x = 2
i = 3, x = 3
i = 4, x = 4
Now run this using the debugger (Debug --> Debug), press the Step button until the highlighted line reaches the demo(0) function call, then press the Step into to inspect this function. Keep pressing the Step button to execute the next lines. Then, modify x by typing x = 10 in the debugger prompt. You should see x changing in the Variable Explorer and when its value is printed as part of the demo() function. (The printed output appears between your debugger commands and responses).
This debugging ability to execute code line by line, to inspect variables as they change, and to modify them manually is a powerful tool to understand what a piece of code is doing (and to correct it if desired).
To terminate the debugger, you can type exit, select Debug --> Stop or press Ctrl-Shift-F12.
1.9.2 Debugging once an exception has occurred in the Console
In the IPython Console, we can call %debug straight after an exception has been raised: this will start the IPython debug mode, which allows inspection of local variables at the point where the exception occurred as described above. This is a lot more efficient than adding print statements to the code an running it again.
If you use this, you may also want to use the commands up (i.e. press u at the debugger) and down (i.e. press d) which navigate the inspection point up and down the stack. (Up the stack means to the functions that have called the current function; down is the opposite direction). You can also enable (or disable) this debugger being triggered automatically when an exception occurs by typing pdb at any time.
1.10 Plotting
You can decide whether figures created with Matplotlib will show
- Inline, i.e. inside the IPython Console, or
- Inside a new window, with an options toolbar.
The first option is convenient to save a record of the interactive session (Ctrl-S in the console).
The second option allows you to interactively zoom into the figure, manipulate it, set various plot and display options, and save it to different file formats via a menu.
The command to get the figures to appear inline in the IPython Console is:
In [ ]: %matplotlib inline
The command to get figures appear in their own window (rendered by the Qt backend) is:
In [ ]: %matplotlib qt
The Spyder preferences can be used to customize the default behavior, under Preferences --> IPython Console --> Graphics --> Graphics Backend.
Here are two lines you can use to quickly create a plot and test this:
In [ ]: import matplotlib.pyplot as plt
In [ ]: plt.plot(range(10), 'o')
1.11 Historical note
This tutorial was originally based on notes by Hans Fangohr, that are used at the University of Southampton to teach Python for computational modelling to undergraduate engineers and postgraduate PhD students for the Next Generation Computational Modelling doctoral training centre.