
Python scripts
to compute temperature increase of nanowire/substrate using analytical approximation (as described here).
Download
A zip and gzipped tar is available for download.
Sample output
Plots
The script that can be downloaded will produce the lines labelled “analytical approx” in the plots shown below. The comparison with the FEM data for particular studies from the publication can be de-activated, and material parameters and geometry can be varied. The README.txt gives more details, and there are guiding comments in the source code.
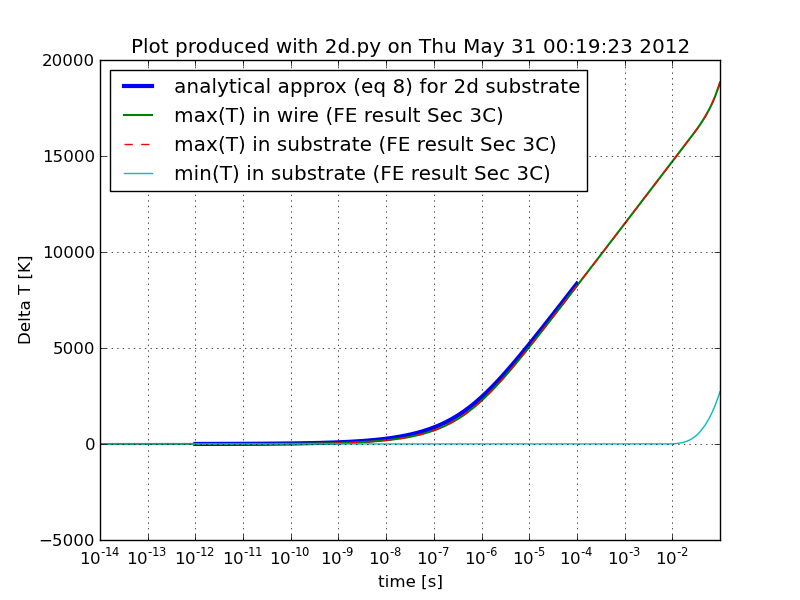
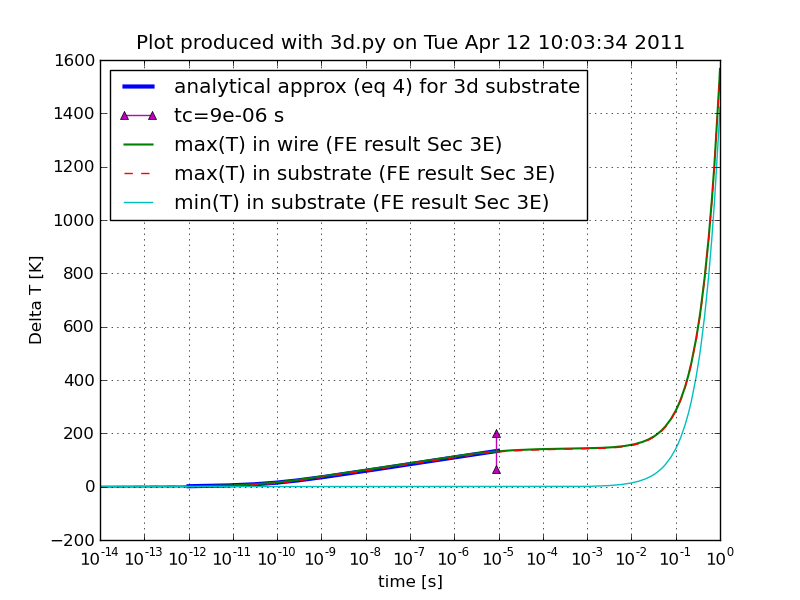
Click on images to see pdf versions.
Data files
The scripts do also write the data into text files such as T_3d_substrate.txt and T_2d_substrate.txt where the first columns represents the time (in seconds) and the second column the maximum temperature of the substrate (which is likely to be the minimum temperature of the wire).
Files that contain 3d refer to a three-dimensional substrate (i.e. substrate much thicker than length of wire) and names with 2d refer to a two-dimensional substrate (i.e. substrate much thinner than length of wire – typical for membranes).
Software requirements
Are detailed in the README.txt file. In short, you need Python and numpy, and – for plotting – matplotlib.
README.txt
Included in the downloadable archive (or here: README.txt).
Disclaimer
The authors nor anybody else assume any responsibility whatsoever for the use of this tool by other parties, and makes no guarantees, expressed or implied, about its quality, reliability, or any other characteristic.
Version
The version available here is (see also version_hg.txt in downloaded file).
changeset:   513:7950bc7b47f0
tag:         tip
user:        Hans Fangohr [MBP13,2011] <fangohr@soton.ac.uk>
date:        Thu May 31 00:25:05 2012 +0100
summary:     Updated files with correct reference to PRB paper.